0.1 Dowload data from Copernicus
Victoria Delannoy, Nicolas Loiseau, Sébastien Villéger
2026-04-09
Source:vignettes/a_load_corpernicus.Rmd
a_load_corpernicus.RmdAims of the function BEE.load.copernicus()
This is an optional function to download data from
the Copernicus
Marine Data Store some dataset. This
function uses the CopernicusMarine Python library. A virtual Python
environment is automatically created to enable it to run in R. If Python
is not already installed on your computer, BEE.load.copernicus
will download it for you.
This allows you to copy and paste the Python API generated on the
copernicus website (Data access>select your data and ONLY one
variable> Automate> Python API) almost directly as an argument for
the BEE.load.copernicus() function.
Usage
To fulfil the argument of the BEE.load.copernicus()
function, you just need to copy and paste the contents of the
copernicusmarine.subset function, which is visible in the Python API,
into the BioExtremeEvent function.
1. To access the API code, go on the Copernicus Marine Data Store page
of the selected products > Data access > in the colonne ‘Subset’
clic on ‘Form’ > select only one variable > select your area of
interest and your date range > on the top of the webpage clic on
Automate > copy/paste whats inside the brakets of the
copernicusmarine.subset() function. You may have to clic on “Show
advanced options” to get all the necessary arguments from the API.
2. Then, add three arguments in BEE.load.copernicus() :
- “username”: which is your username from the Copernicus Marine
Data Store. Don’t forget the “” !
- “password”: your Copernicus Marine Data Store passeword.
Don’t forget the “” !
- output_directory: The path where you want to store your
dataset.
You can now run the function.
Output
There is no direct output in R environment, the data are saved in local. Refer to the ‘Example of the dataset obtained’ section to see how to load the data into your R environment.
Example
Download data:
library(BioExtremeEvent)

BioExtremeEvent::BEE.load.copernicus(
    username = my_user_name, # In addition of the API copy&paste
    password = my_password, # In addition of the API copy&paste
    dataset_id = "cmems_SST_MED_SST_L4_REP_OBSERVATIONS_010_021",
    dataset_version = "202411",
    variables = "analysed_sst", # Select only one variable !
    minimum_longitude = 3.0194165746371, # Use the "draw on map" option form the website
    # to fill the gps coordinates
    maximum_longitude = 4.5708413084348,
    minimum_latitude = 42.8901433211107,
    maximum_latitude = 43.5923510331374,
    start_datetime = "1982-01-01T00:00:00", # Use the 'Date range' settings
    end_datetime = "2025-12-31T00:00:00",
    coordinates_selection_method = "strict-inside",
    disable_progress_bar = TRUE,
    output_directory = here::here("Data") # In addition of the API copy&paste
)
Load dataset in R environment:
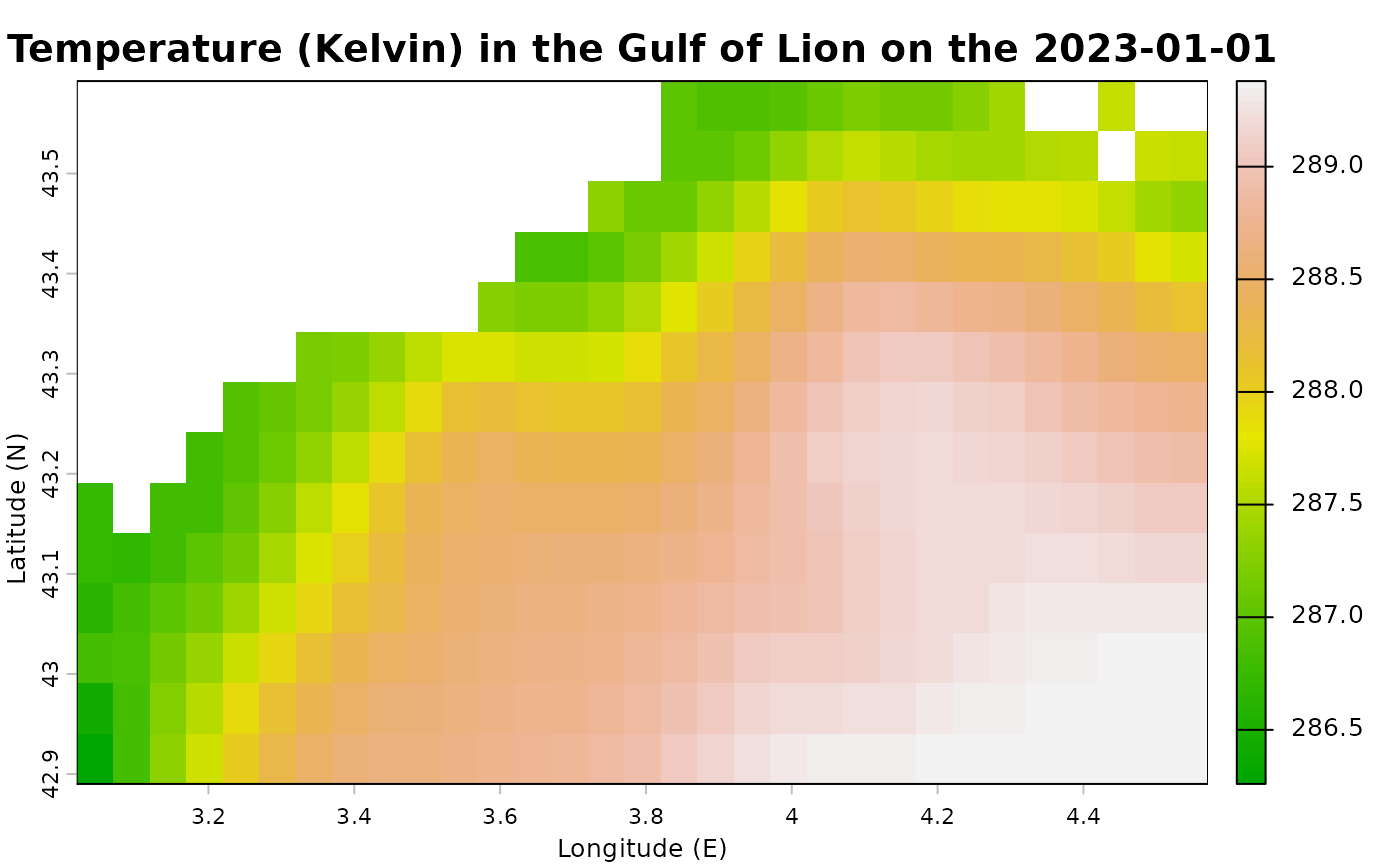
copernicus_data <- terra::rast("output_directory/your_dataset_name.nc") #Adapt your file name.Example of the dataset obtained
# Plot first layer (Sea surface temperature the first day of the dataset) :
terra::plot(
  copernicus_data[[1]],
  main = paste("Temperature (Kelvin) in the Gulf of Lion on the", terra::time(copernicus_data[[1]]) ),
  xlab = "Longitude (E)",
  ylab = "Latitude (N)",
  col = terrain.colors(100),
  legend = TRUE
)