3.2 Check how much corrected extreme events differ from raw extreme days.
Victoria Delannoy, Nicolas Loiseau, Sébastien Villéger
Source:vignettes/f_calc_corrections.Rmd
f_calc_corrections.RmdAims of the function BEE.calc.corrections().
The function compares former binarized value to corrected binarized value. It takes as argument the two element of BEE.id.extreme_events() output. It is a quick way of testing the implications of various settings in BEE.id.extreme_events().
Usage
Arguments:
true_event_raster: The first element of the
BEE.id.extreme_events() ouput, which is a spatraster binarized
that inclued the corrections made by
BEE.id.extreme_events().
true_event_df: The second element of the
BEE.id.extreme_events() ouput, which is a list of data.table
containing information about the value of each pixel before and after
definition criteria are applied to distinguish isolated extreme days
from extreme events.
plot: Accepted values are TRUE of FALSE. Set to “FALSE”
to not display the graphs.
Warnings:
No warning implemented yet.
## Messages: A message will be sent out providing basic information on
the number of days that have been reclassified as part of an extreme
event, or excluded from one.
Output
The output is a data frame containing one row for each combination of
date and pixel. It contains the count of corrections from 1 to 0 and
from 0 to 1, which are provided in case users want to run their own
tests. However, the main interest lies in the plots that are created by
the function.
The first plot shows the cumulative percentage of values that have been
modified amongst all non-NA values over time. This allows us to
visualise whether the corrections are homogeneous over time. If so, the
lines drawn should be straight. The same graph also allows you to check
whether a similar percentage of non-NA values have been changed to 1 and
to 0.
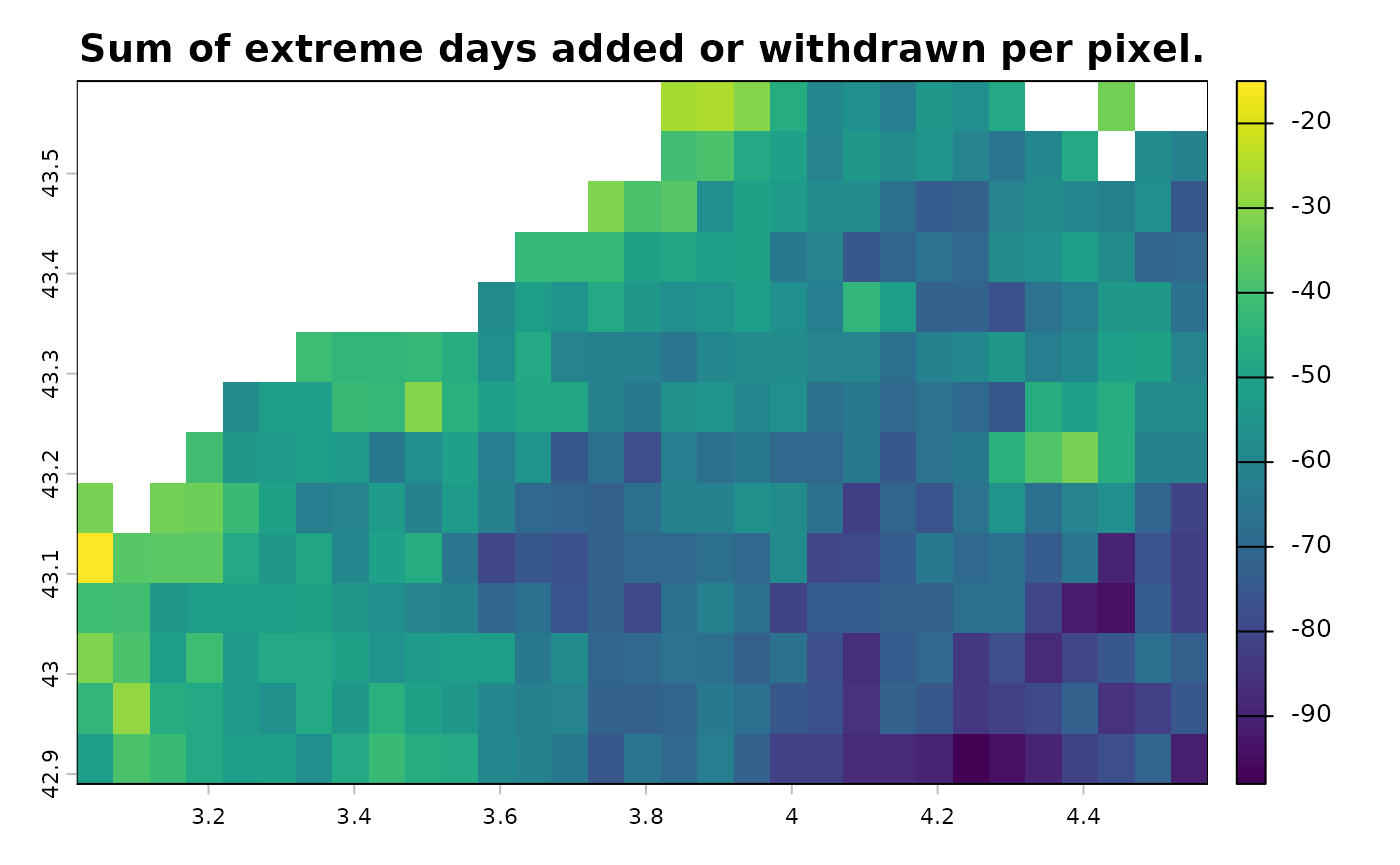
The second graph allows you to check whether the corrections are
homogeneous across the area. It plots the studied area and shows the
difference between the number extreme days that have been added and the
number extreme days that have been withdrawn, for each pixel. If a pixel
value is negative, it means that, over the entire time period, more
extreme days have been removed than added for that pixel.
| Column name | Description | Class | Unit |
|---|---|---|---|
| pixel_id | Pixel number in the spatraster | integer | |
| original_value | Day more extreme than baseline = 1 | double | |
| Day less extreme than baseline = 0 | |||
| cleaned_value | Day belong to an exteme event = 1 | double | |
| Day outside of an extreme event = 0 | |||
| event_id | Number of the extreme event in the | integer | |
| time serie | |||
| duration | Duration of the period (extreme | integer | days |
| event or in between 2 events) | |||
| date | Date associated to the observation | Date | |
| ID | The event identifier * | character | |
| delta | cleaned_value - original value | double | days |
| one_to_zero | Number of days changed from 1 to 0 | double | days |
| zero_to_one | Number of days changed from 0 to 1 | double | days |
Examples
Load data:
library(BioExtremeEvent)
#Binarized spatraster corrected built using BEE.id.extreme_events()
file_name_1 <- system.file(file.path("extdata", "binarized_corrected_spatraster.tiff"),
                                   package = "BioExtremeEvent")
binarized_corrected_spatraster <- terra::rast(file_name_1)
#List of dataframe containning information about former and corrected binarised values, built using BEE.id.extreme_events()
file_name_2 <- system.file(file.path("extdata", "binarized_corrected_df.rds"),
                                   package = "BioExtremeEvent")
binarized_corrected_df <- readRDS(file_name_2)
See how the extreme event definition used in article 3. Identify extreme event according specific constraints. has modified the number of extreme days.
df_count_modif <- BEE.calc.corrections(true_event_raster = binarized_corrected_spatraster,
                                       true_event_df_list = binarized_corrected_df,
                                       plot = TRUE)
## Number of 0 corrected to 1: 1706
## Number of 1 corrected to 0: 22628
## Percentage of non NA values corrected from 0 to 1: 0.45318344100646
## Percentage of non NA values corrected from 1 to 0: 6.01092315538932
## 6.46410659639578 % of the non NA values have been modified.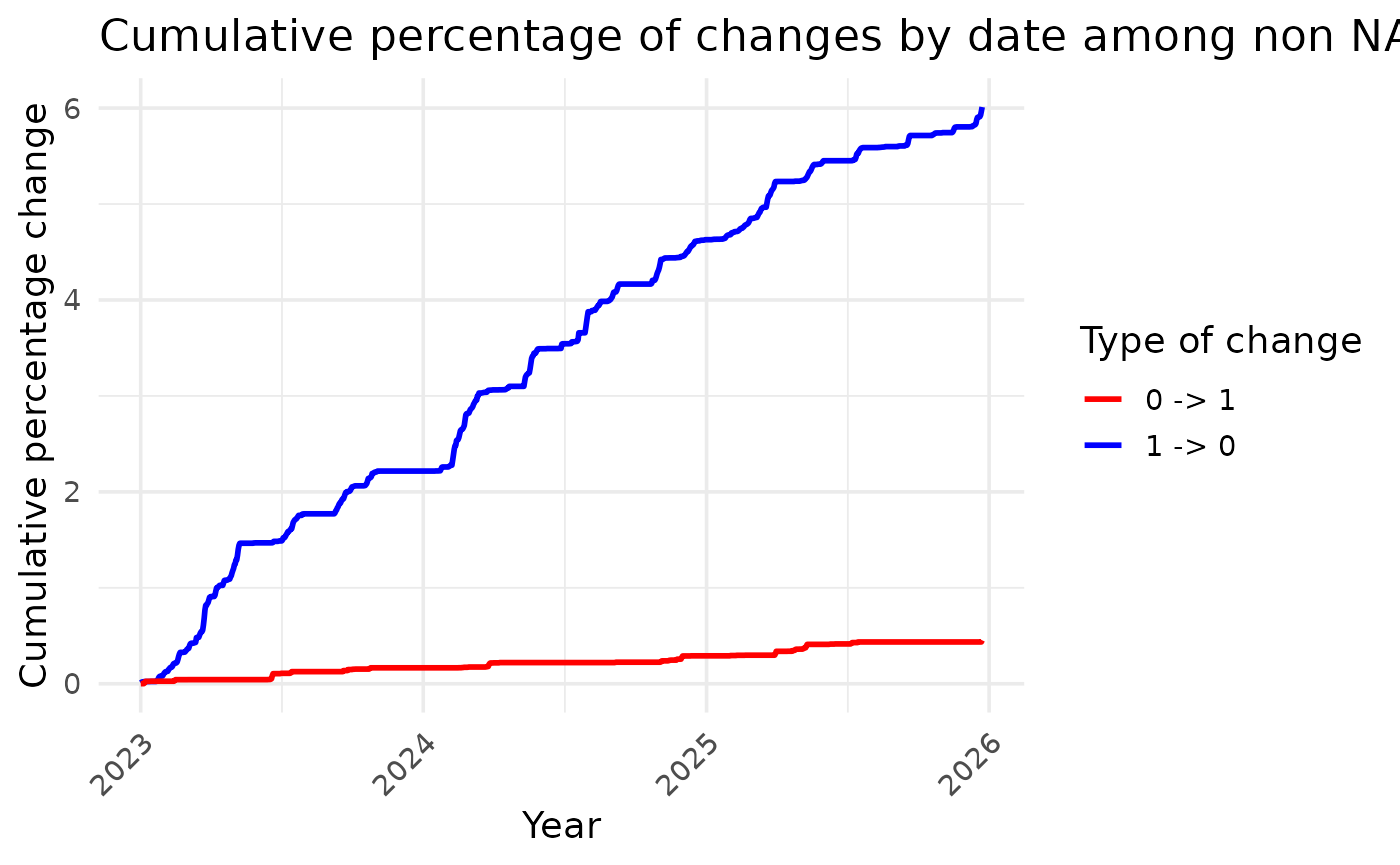
How to save the ouputs:
write.csv(df_count_modif, file = "your_path/data/df_count_modif.csv")