1. Compute a baseline value
Victoria Delannoy, Nicolas Loiseau, Sébastien Villéger
Source:vignettes/c_calc_baseline.Rmd
c_calc_baseline.RmdIn this pipeline, an extreme event is identified in a given location
if the value of the studied parameter exceeds a reference value. This
reference value can be fixed over time, as with a biologically defined
threshold or an absolute physical limit. Alternatively, it can be
derived from the distribution of a historical time series. In this
frequentist approach, the threshold is defined as a given percentile of
the observed values. For example, if a 90^th percentile thershold is
used, a daily value will be considered as ‘extreme’ if it is higher than
90 % of the values observed for the same day of the years across all the
years that are used as reference. This second approach is commonly used
when there are no a priori hypotheses about what values
constitues an extreme value for the studdied ecosystem, and when the
hypothesis is that anything more intense than what the ecosystem is
accoustomed to may induce unusual modifications. Alternatively, the mean
value observed in the time series can be used to compute a daily
baseline value. To proceed accroding to this method, the pipeline
involves three steps :
- First, the baseline value is computed using the
BEE.calc.baseline() function.
- Then, each day of the studied time period is compared to the baseline
value, and days above (or below) the threshold are identified using
BEE.id.extreme_day(). If you are working with a fixed baseline,
you can skip BEE.calc.baseline() and go straight to
BEE.id.extreme_day().
- Finally, you can apply a filter to BEE.id.extreme_day()
output to add additional criteria to the ‘extreme event’ definition.
This could be a minimum duration or a tolerance of a certain number of
days below the baseline value within an extreme event. See
BEE.id.extreme_events().
Aims of the function BEE.calc.baseline()
BEE.calc.baseline() computes the daily baseline value for each day. You can choose the percentile value to use when computing your baseline. Futher along the pipeline, this baseline is used to identify extreme event and compute some metrics about the extreme event.
Data for this tutorial
copernicus_data_celsius is a spatraster form copernicus, converted from Kelvin to celsius using BEE.convert.celsius(). It has one layer per day between 2023-01-01 and 2025-12-31 and cover around 10 000 km² in the corner of the gulf of lion. See article 0. Download data from Copernicus for more informations and 0.bis. Convert tempreature data to Celsius.
Usage
Arguments:
yourspatraster: is a spatraster with one layer per
day. Each layer covers the same area, and the time series must encompass
the start_date and end_date provided as argument.
start_date and end_date: are the
limits of the time period you want to consider has the reference value
to compute the baseline. Please ensure that the date format matches that
of the provided spatraster. You can check the format using
terra::time(yourspatraster).
threshold: is the argument specifying whether you want
to compute a percentile value of the time serie or the mean value.
Arguments accepted are:
- “qt” (quantile), to calculate a percentile. -
“mean”, to calculate the mean value across the time
serie.
quantile_value: is a numerical argument to specify the
value of the quantile you want to compute. If threshold = “mean”, the
quantile_value argument will be ignored.
time_window: number of days on either side of day ‘d’
that are used to calculate the threshold value associated for day ‘d’.
For example, if “time_window = 5”, the thershold value for ‘d’
day will be calculated using data from five days before day d, day d
itself, and the five days after day d, from all years between
“start_date” and “end_date”. See ‘Examples’ section
below to see how it can affect baseline value.
Warning: this argument is not related to the minimum number of days
required to distinguish an ‘extreme day’ from an ‘extreme event’. This
will be addressed later in the BEE.id.extreme_events() function.
smooth_window: number of days on either side of day ‘d’
that are used to calculate the mean value of the threshold assigned to
the ‘d’ day. This allows your threshold value to be smoothed across
days. For example, if “smooth_window” is set to 10 days, the
final value on day ‘d’ will be the mean of the baseline/thershold values
calculated for days: d - 10 to d + 10 (eleven values). See ‘Examples’
section below to see how it can affect baseline value.
Warnings:
You will receive a warning if :
- “start_date” and/or “end_date” provided are not within the dates of the providid spatraster.
- “start_date” and/or “end_date” are in a different format than the dates of the provided spatraster.
Examples
Calculate the baseline value for each day of a year using the 90^th percentile threshold and all values between d-5 and d+5. Then smothing over a 15 days period centred on the d day:
library(BioExtremeEvent)
#### Smoothing over 15 days: # 18s to run
baseline_qt90_smth_15 <- BEE.calc.baseline(yourspatraster = copernicus_data_celsius,
                                    start_date = "2023-01-01",
                                    end_date = "2025-12-31",
                                    threshold = "qt",
                                    quantile_value = 0.9,
                                    time_window = 5,
                                    smooth_window = 7) #7+1+7=15
For a given pixel, it produces a baseline value for each day of the year:
The shorter the reference time series, the more useful the
‘time_window’ argument is for dealing with NA days and avoiding
distortion of the baseline by a few peaks events.
The “smoothing_window” reduces day-to-day discontinuity. It is
particularly useful when time series are short and erratic, but it tends
to ‘flatten’ seasonal steep slopes, peaks and trough. The following
examples illustrate how these two arguments can modify the obtained
baseline:
*For the purpose of this example, baseline is computed on a large
spatraster than the one commonly use in this tutorial. The following
arguments are used in all the graphs below:
- start_date = “1982-01-01” - end_date = “2010-12-31” - threshold = “qt”
- quantile_value = 0.9
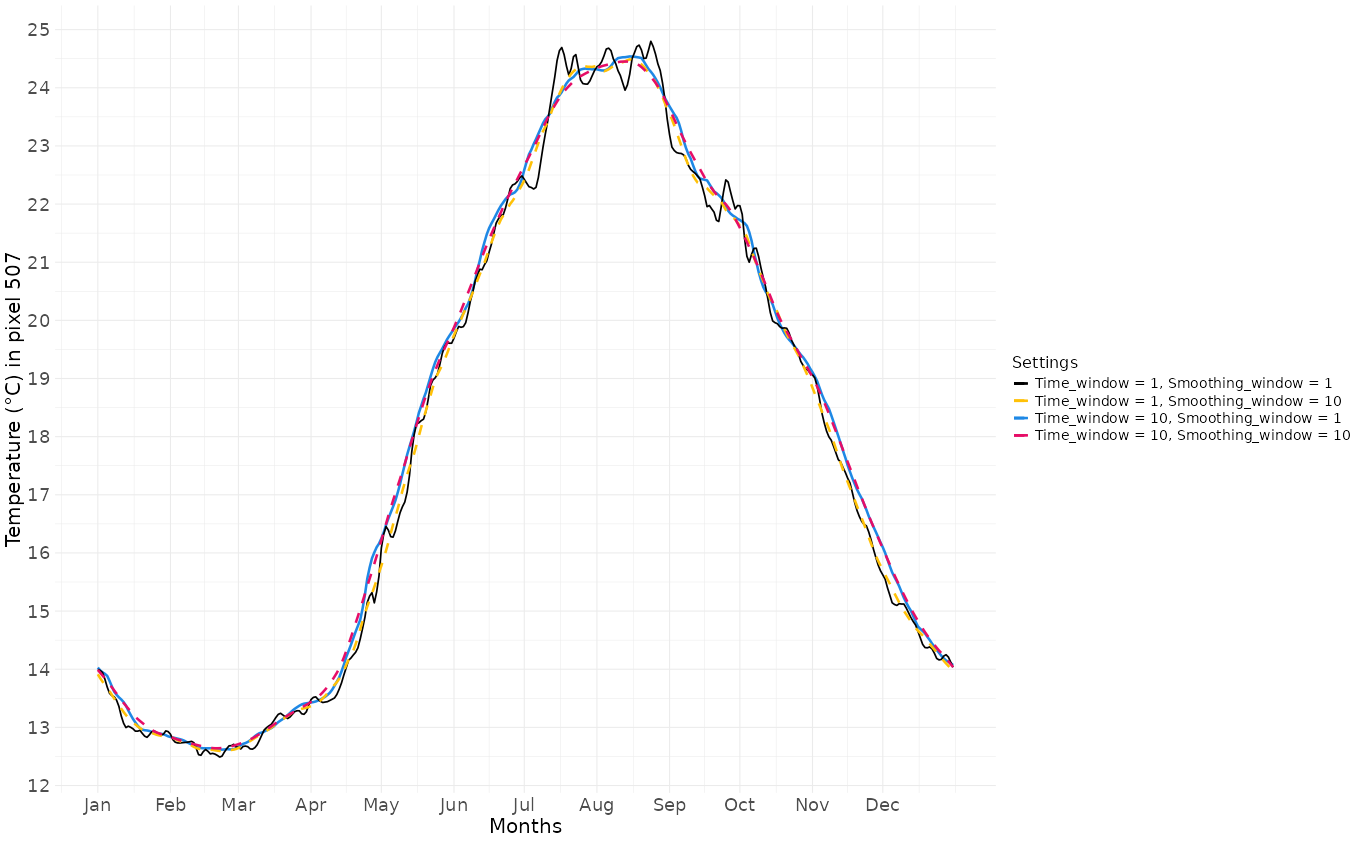
Baseline values according combinaisons of time_window and smoothing_window
How to save output:
terra::writeRaster(baseline_qt90_smth_15, "your_path/data/baseline_qt90_smth_15.tiff")