5. Calculate metrics on the shape of an extreme event.
Victoria Delannoy, Nicolas Loiseau, Sébastien Villéger
Source:vignettes/h_calc_metrics_morpho.Rmd
h_calc_metrics_morpho.RmdAims of the function BEE.calc.metrics_morpho().
Compute daily metrics of spatial features of the extreme event (only in surface, 2D).
Usage
Arguments:
extreme_event_spatraster :
The SpatRaster you want to analyse (first output of
BEE.id.extreme_events()).
start_date :
Allows to perform the analysis on a specific time_frame, this allows to
save computation time.
end_date : Allows to perform the analysis on a specific
time_frame, this allows to save computation time.
per_pix : Use TRUE if you want a list with one dt per
pixel as an output. Use TRUE to be able to use the output in
BEE.data.merge().
Warnings:
You will receive a warning if :
- “start_date” and/or “end_date” formats do not match the format of the spatrasters layer name. Please note that some mismatches in the date format may still not be detected. To be sure, compare your “start_date” and “end_sate” with terra::names(extreme_event_spatraster[[1:10]]).
Messages:
You will receive a message in the following case :
- The number of NA pixels is not consitent through the layers, some
metrics
Output
You will get a list of dataframes containning the informations in the table bellow and a spartaster with all the extreme events, identified daily: Below, ‘patch’ is used to describe a group of neighbouring pixels on a given date.
| Column name | Description | Class | Unit |
|---|---|---|---|
| pixel_id | Pixel number in the spatraster | integer | |
| x | Longitude | double | decimal degree |
| y | Latitude | double | decimal degree |
| patch_id | Extreme event polygon identifier | double | |
| cell_size | Area of the pixel | m² | |
| boredering | Whether the pixel is on the border of | double | 1 or 0 |
| the patch (1) or not (0). | |||
| patch_area | Total area of the extreme event on a | double | m² |
| core_area | Area of non-boredering pixels | double | m² |
| of an extreme event on a given day | |||
| core_area_index | patch_are/core_area | double | no unit |
| n_pixel | number of pixels belong to the | double | pixels |
| extreme event | |||
| pixel_EE_tot | Total number of pixels in extreme | double | pixels |
| event (all extreme events that | |||
| occured on that day) | |||
| cover_percent | Percentage of non-NA area that is | double | percentage |
| covered by this extreme event (cf ID) | |||
| n_core_pixel | Number of pixels in the extreme event | double | pixels |
| that do not border the patch | |||
| date | Date associated to the observation | Date | |
| ID | The event identifier * | character | |
| perimeter | Perimeter associated to the extreme | double | m |
| event patch | |||
| centroid_x | centroid longitude of the patch | double | degrees |
| centroid_y | centroid latitude of the patch | double | degrees |
| perim_pixel_ratio | Pixels on patch limit / total number | no unit | |
| pixels in the patch | |||
| perim_area_ratio | Perimter (in m) / area (in m² ) | double | m⁻¹ |
| shape_index | 0.25*perimeter/sqrt(area) | double | no unit |
| fractal_cor_index | 2log(0.25 perimeter)/log(area) | double | no unit |
| contiguity_index | Number of pixel from a patch within | double | pixels |
| the 8 pixels around each pixel from | |||
| the patch. For more info see: | |||
| ?landscapemetrics::lsm_p_contig | |||
| ell_dir | The angle between the north direction | double | degrees |
| and the longest axis of the smallest | |||
| ellipse that surrounds a patch. | |||
| ell_crop_area_m2 | Ellipse area within the raster | double | no unit |
| ell_tot_area_m2 | Ellipse total area | double | m² |
| ell_long_axis | Longest ellipse axis length | double | m |
| ell_short_axis | Shortest ellipse axis length | double | m |
| patch_ell_ratio | Patch area / ellipse area | double | no unit |
* Same format as the in the spatraster provided (here yyyy-mm-dd)
Find out more about ellipse computation and related metrics:
The ellipses computed in this package are the smallest ellipses that encapsulate the centres of all the pixels within a patch. They are computed daily. Since the calculation is based on the coordinates (in degrees) of the centre of the pixels in a patch, no ellipse can be computed for patches that form a line (vertical, horizontal or diagonal). Indeed, since all the coordinates used to compute the ellipse are aligned, no width can be assessed. Ellipse computations are performed in two steps: first, the coordinates (in degrees) are computed based on the centre pixel coordinates (in degrees) using the cluster::ellipsoidhull() function. The axis lengths, azimuth or area computed by cluster::ellipsoidhull() cannot be used directly because cluster::ellipsoidhull() does not take into account deformation due to the degree reference. To avoid this issue, the ellipse properties are re-computed ‘manually’ using the coordinates of the ellipse perimeter (in degrees), and the axis lengths are calculated using functions such as terra::expanse(). Functions in the terra package compute distances and areas using projection onto a sphere, which is much more precise than projection onto a plane. According terra : “For vector data, the best way to compute area is to use the longitude/latitude CRS. This is contrary to (erroneous, but popular) belief that you should use a planar coordinate reference system.” Please do not hestitate to check the function code available on the github page starting line 369.
Examples
Load data:
We need the spatraster “stacked_rasters_corrected”, wich is an ouptut of BEE.calc.id_extreme_event().
library(BioExtremeEvent)

file_name_1 <- system.file(file.path("extdata",
                                      "binarized_corrected_spatraster.tiff"),
                                      package = "BioExtremeEvent")
extreme_event_spatraster <- terra::rast(file_name_1)
Get metrics by pixel:
# Warning, this can takes a minute or two.
list_morpho_metrics <- BEE.calc.metrics_morpho(extreme_event_spatraster, start_date = "2024-02-01", end_date = "2025-11-30", per_pix=TRUE)
/! In the list of dataframe (first output of BEE.calc.metrics_morpho()) are NAMED according pixel_id, which allows you to extract a dataframe by it’s NAME. If you extract a dataframe by its position in the list, you will not get the dataframe associed to the expected pixel.
# If looking for the datafrmae associated to pixel number 214, use "214", not 214:
df_list <- list_morpho_metrics[[1]] # get the dataframe list
# Get dataframe associated to pixel 214:
pixel_214 <- df_list[["214"]] # Don't forget the "" !

# Get the 214^th dataframe :
pixel_unknown <- df_list[[214]]
pixel_unknown$pixel_id[1] ; names(df_list[214])
## [1] 302## [1] "302"
# The dataframe pixel_unkown is associated to pixel number 302
# This is why it is important to extract dataset from the list using the NAME (using "pixel number").
Get metrics by patch x day :
list_morpho_metrics_EE <- BEE.calc.metrics_morpho(extreme_event_spatraster, start_date = "2024-05-01", end_date = "2024-11-30", per_pix=FALSE)How to save the ouputs:
If you used per_pix=TRUE, outputs are a list of dataframe, with one dataframe per pixel and a spatraster. To save your list of dataframe:
df_list <- list_morpho_metrics[[1]]
saveRDS(df_list, file = "your_path/data/metrics_morpho_pixel.rds")
To save the spatraster:
patch_spatraster <- list_morpho_metrics[[2]]
terra::writeRaster(patch_spatraster, "your_path/data/patch_spatraster.tiff")
I you used per_pix=FALSE the ouptuts are a dataframe (within a list) and a spataraster. Spatraster do not differ whether you use per_pix =TRUE or per_pix =FALSE. To save the dataframe with morphometrics values per patch :
patch_df <- list_morpho_metrics_EE[[1]] # get first object of the ouput
saveRDS(patch_df, file = "your_path/data/metrics_morpho_patch.rds")

# To avoid saving the dataframe as a list of one object, you can extract it from the list before saving:
patch_df_unlisted <- patch_df[[1]] #extract the df from the list
write.csv(patch_df_unlisted, file = "your_path/data/metrics_morpho_patch.csv")
Plots
Very basic plot of a metric through time:
Quick plot of patches for a given pixel.
library(ggplot2)

# Metrics from a given position (pixel n°130):
df_list <- list_morpho_metrics[[1]]
pixel_302 <- df_list[["302"]]
# Convert area from m² to km²:
pixel_302$patch_area_km2 <- pixel_302$patch_area / 1e6

# Plot:
ggplot(pixel_302, aes(x = date,
                      y = patch_area_km2)) +
  geom_line(na.rm = FALSE, color = "darkorange") +
  scale_x_date(date_breaks = "1 month",
               date_labels = "%Y-%m") +
  labs(x = "Date",
       y = expression("Patch area (km"^2*")")) +
  theme_minimal() +
  theme(axis.text.x = element_text(angle = 45, vjust = 0.5))
## Warning: Removed 147 rows containing missing values or values outside the scale range
## (`geom_line()`).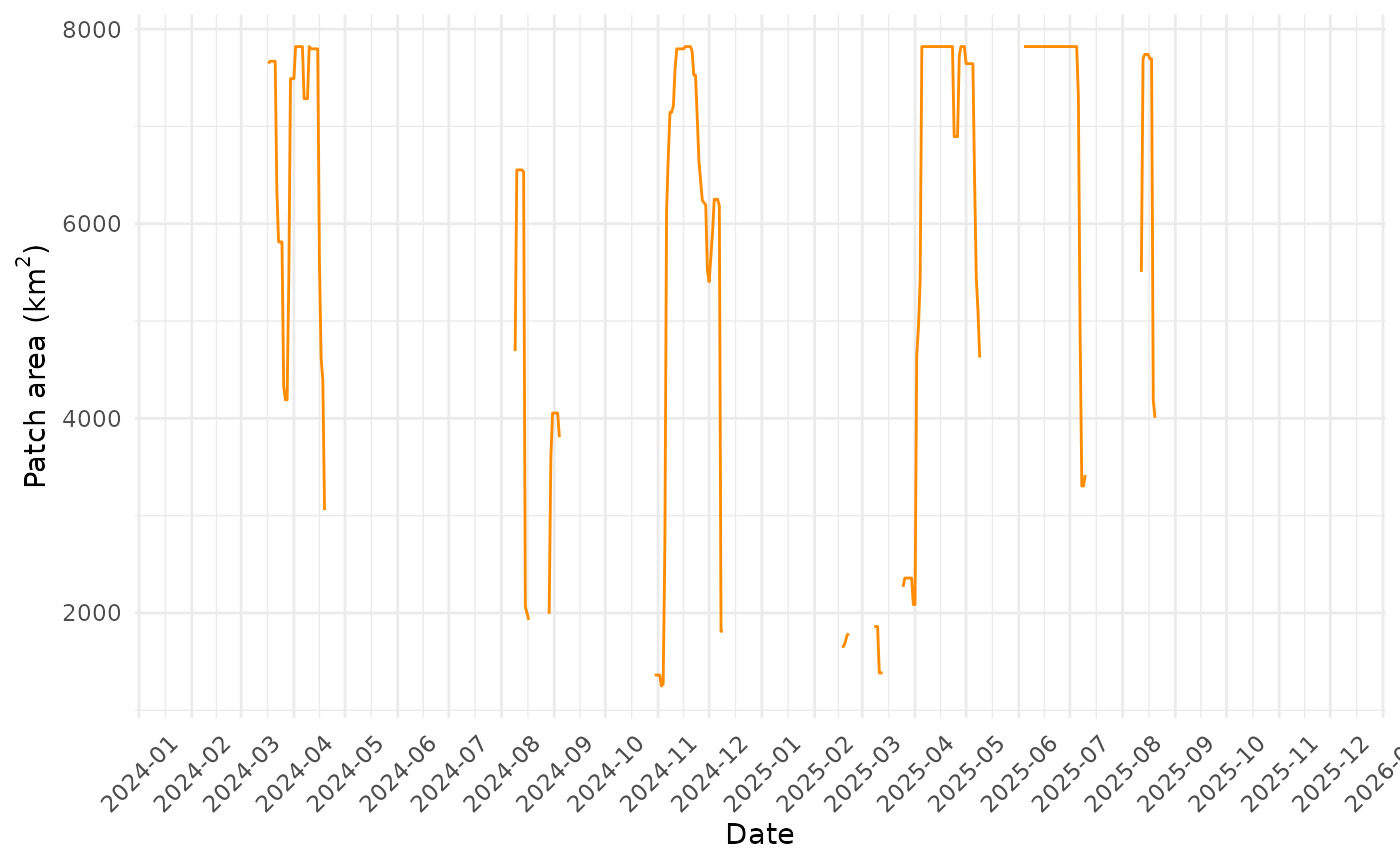
If the area is small (as in our example), there is little intrest in plotting a metric for different pixel according to time. In deed, since sevral pixels belong to the same patch, they will often have the same value of area, perimeter etc.
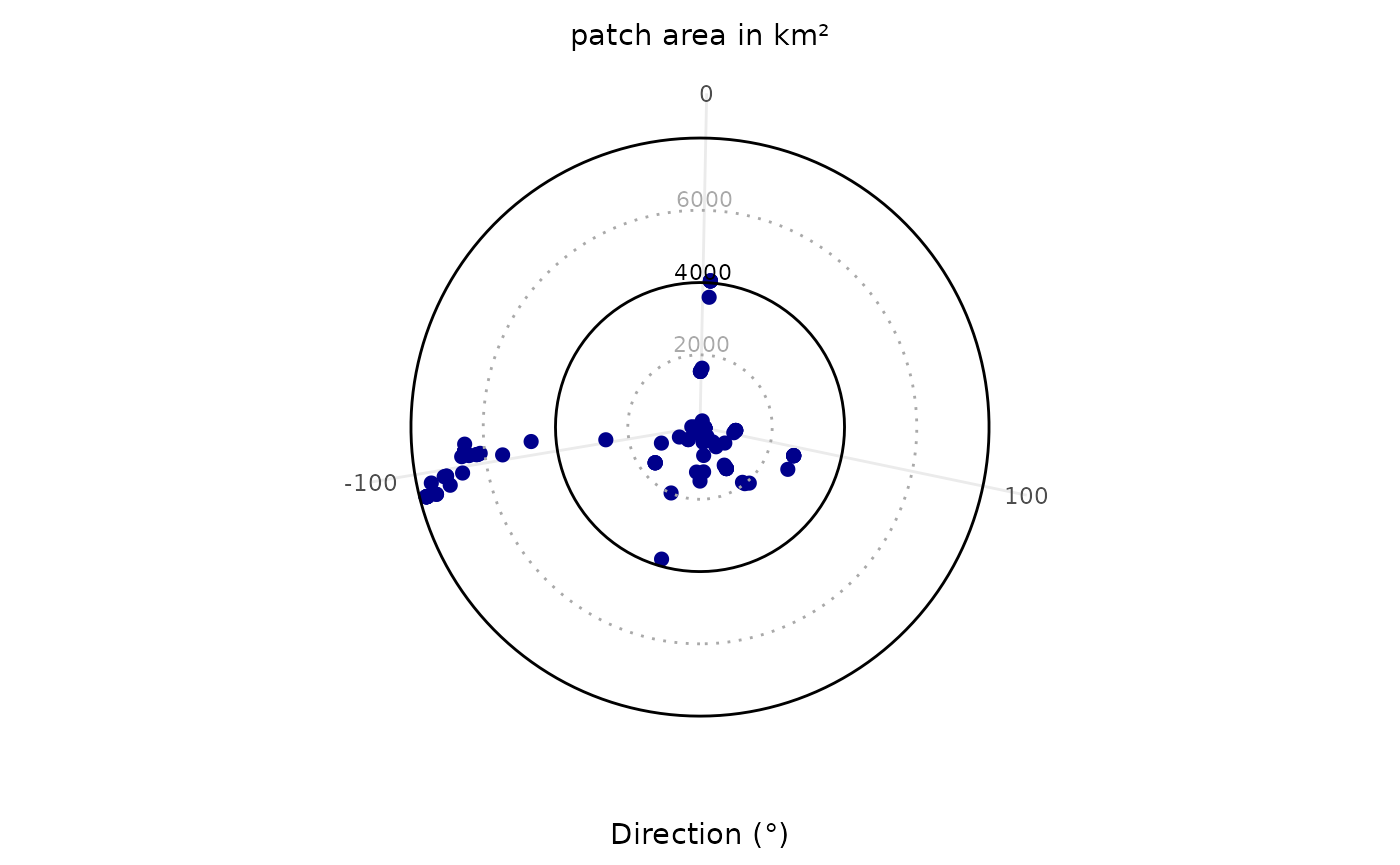
Plotting patch area according azimut of the ellispe fitted on the patch:
patch_df <- list_morpho_metrics_EE[[1]] #list of dataframe
patch_df <- dplyr::bind_rows(patch_df) #one big dataframe

#Converte m² to km²:
patch_df$patch_area_km2 <- patch_df$patch_area / 1e6

#Plot
library(ggplot2)

max_val <- max(patch_df$patch_area_km2, na.rm = TRUE)

ggplot(patch_df, aes(x = ell_dir, y = patch_area_km2)) +
  #on point per patch (per day):
  geom_point(color = "darkblue", size = 2) +
  coord_polar(theta = "x", start = pi, direction = 1) +
  scale_y_continuous(
    limits = c(0, max_val * 1.05),
    breaks = c(2000, 4000, 6000, 8000),
    expand = c(0, 0)
  ) +
    #dark lines for 4000 and 8000 (please ajust to the sacle of your data):
  geom_hline(yintercept = c(4000, 8000), color = "black", size = 0.5, linetype = "solid") +
    #grey dotted lines:
  geom_hline(yintercept = c(2000, 6000), color = "darkgrey", size = 0.5, linetype = "dotted") +
  labs(x = "Direction (°)", y = NULL, title = "patch area in km²") +
  theme_minimal() +
  theme(
    axis.title.y = element_blank(),
    axis.text.y = element_blank(),
    axis.ticks.y = element_blank(),
    panel.grid.major.y = element_blank(),
    panel.grid.minor = element_blank(),
    plot.title = element_text(hjust = 0.5, vjust = -0.5, size = 11)
  ) +
    # add breaks values (circles):
  annotate("text", x = 0, y = 2000 + 300, label = "2000", color = "darkgrey", size = 3, hjust = 0.5) +
  annotate("text", x = 0, y = 4000 + 300, label = "4000", color = "black", size = 3, hjust = 0.5) +
  annotate("text", x = 0, y = 6000 + 300, label = "6000", color = "darkgrey", size = 3, hjust = 0.5) +
  annotate("text", x = 0, y = 8000 + 300, label = "8000", color = "black", size = 3, hjust = 0.5)
## Warning: Using `size` aesthetic for lines was deprecated in ggplot2 3.4.0.
## ℹ Please use `linewidth` instead.
## This warning is displayed once per session.
## Call `lifecycle::last_lifecycle_warnings()` to see where this warning was
## generated.## Warning: Removed 30 rows containing missing values or values outside the scale range
## (`geom_point()`).## Warning: Removed 1 row containing missing values or values outside the scale range
## (`geom_text()`).