7. Merge the the ouput of BEE.calc. functions in one dataframe.
Victoria Delannoy, Nicolas Loiseau, Sébastien Villéger
Source:vignettes/k_data_merge.Rmd
k_data_merge.RmdAims of the function BEE.data.merge()
Merge the ouputs of BEE.calc.metrics_point(), BEE.calc.metrics_morpho() and/or BEE.calc.escape() in one df per pixel. Among other thing, this allows to link daily patch to an extreme event.
Usage
Arguments:
data_metrics_point:
The list of dataframe provided in the ouput of
BEE.calc.metrics_point().
data_metrics_morpho:
The list of dataframe provided in the output of
BEE.calc.metrics_morpho() (The first object, the second on is a
spatraster not used here.) data_escape:
The list of dataframe provided in the output of
BEE.calc.escape(). crs The CRS of the
Spatraster that you have used so far to compute the baseline and
identify the extreme event. The function does not modify the CRS of your
coordinates. CRS is only used to build polygons and check that the
datasets you have provided cover the same area.
Warnings:
You will receive a warning if :
- The CRS you provided is not recognised by ‘terra’ package. Use the
‘terra::crs()’ function on the spatial arrays you have provided to the
BEE.calc.baseline() or BEE.calc.metrics_morpho()
functions, for example.
- You didn’t provided datasets to merge together or you provided only one dataset.
- Some dates are missing in one of the dataset or the resolution is not daily.
- Some of the provided datasets do not share dates, so merging is not possible. Please compute the metrics for the same time period.
- The provided datasets do not cover the same spatial area, so merging is not possible. Please compute the metrics for the same spatial raster (without cropping during the workflow).
Examples
Load data:
library(BioExtremeEvent)
file_spatraster <- system.file(file.path("extdata",
                                      "copernicus_data_celsius.tiff"),
                                      package = "BioExtremeEvent")
copernicus_data_celsius <- terra::rast(file_spatraster)

file_name_1 <- system.file(file.path("extdata",
                                      "escape_pixel.rds"),
                                      package = "BioExtremeEvent")
escape_df_list <- readRDS(file_name_1)

file_name_2 <- system.file(file.path("extdata",
                                      "metrics_morpho_pixel.rds"),
                                      package = "BioExtremeEvent")
morpho_df_list <- readRDS(file_name_2)

file_name_3 <- system.file(file.path("extdata",
                                      "metrics_points_pixel.rds"),
                                      package = "BioExtremeEvent")
point_df_list <- readRDS(file_name_3)
Apply function on three dataset:
library(BioExtremeEvent)

merged_ouputs <- BEE.data.merge(
                        yourspatraster = copernicus_data_celsius,
                        data_metrics_point = point_df_list,
                        data_metrics_morpho = morpho_df_list,
                        data_escape = escape_df_list,
                        crs= "EPSG:4326")
## Warning: [as.points] returning a copy
## Warning: [as.points] returning a copy
## Warning: [as.points] returning a copyYou can also provide only two data_… arguments to the function.
How to save the ouputs:
The output is a list of dataframe, you can save it as follow:
saveRDS(merged_ouputs, file = "your_path/data/merged_ouputs.rds")Plots
You can know work on the outputs of sevral functions :
pixel_108 <- merged_ouputs[["108"]] #Dont forget the quote or you may get an unexpected pixel

#Check if the more intense day are also the one for which the distance to escape from the extreme event are bigger.
library(ggplot2)

ggplot(pixel_108, aes(x = as.numeric(pixel_108$anomaly_qt), y = as.numeric(pixel_108$distance)/1000)) +
  geom_point(color = "steelblue", size = 3, alpha = 0.7) +
  labs(
    title = "Anomaly vs Distance",
    x = "Anomaly (°C)",
    y = "Distance (km)"
  ) +
  theme_minimal() +
  theme(
    plot.title = element_text(size = 14, face = "bold", hjust = 0.5),
    axis.title = element_text(size = 12),
    axis.text = element_text(size = 11),
    panel.grid.major = element_line(color = "gray90"),
    panel.grid.minor = element_blank()
  )
## Warning in FUN(X[[i]], ...): NAs introduced by coercion## Warning: Use of `pixel_108$anomaly_qt` is discouraged.
## ℹ Use `anomaly_qt` instead.## Warning: Use of `pixel_108$distance` is discouraged.
## ℹ Use `distance` instead.## Warning: Removed 97 rows containing missing values or values outside the scale range
## (`geom_point()`).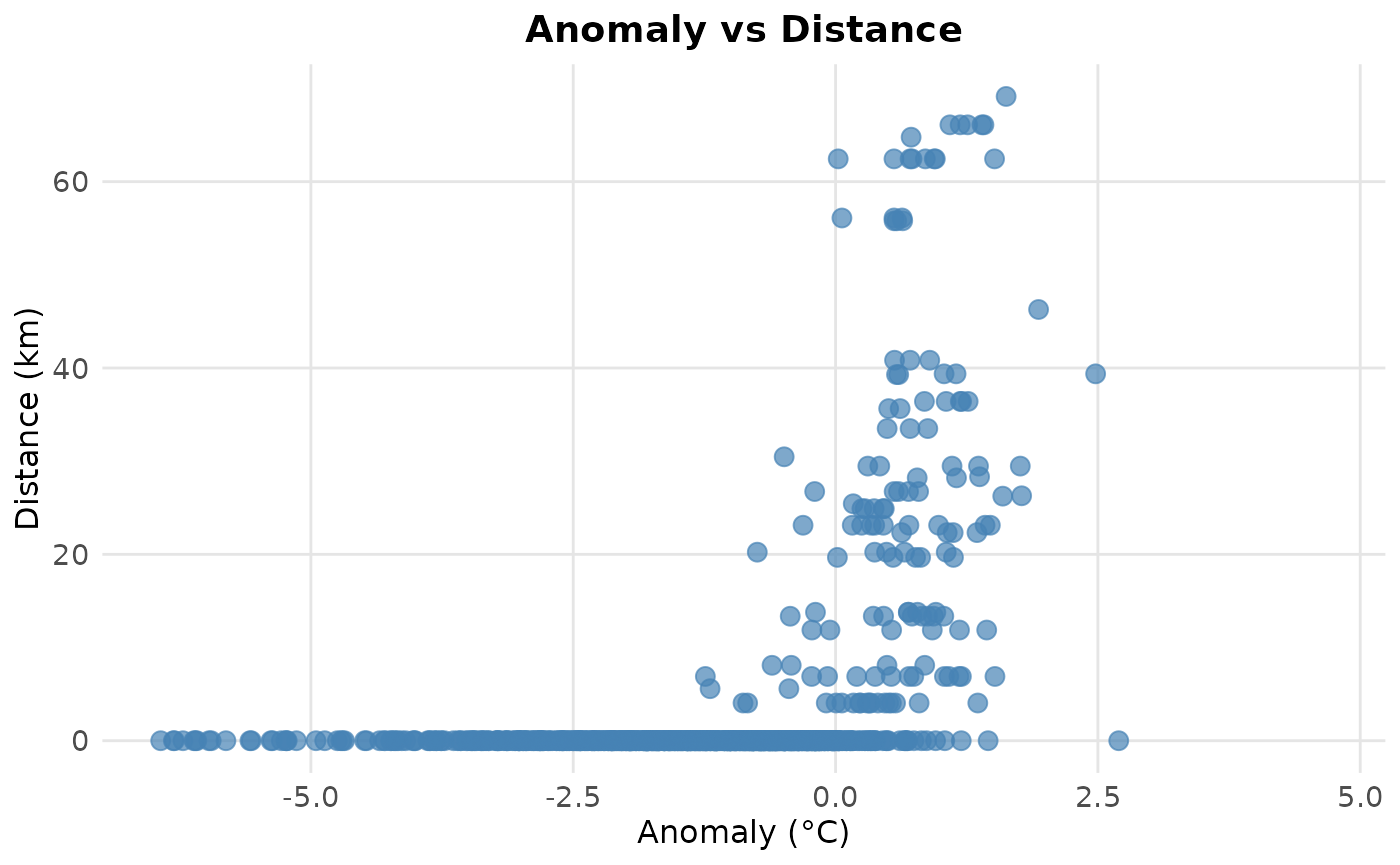
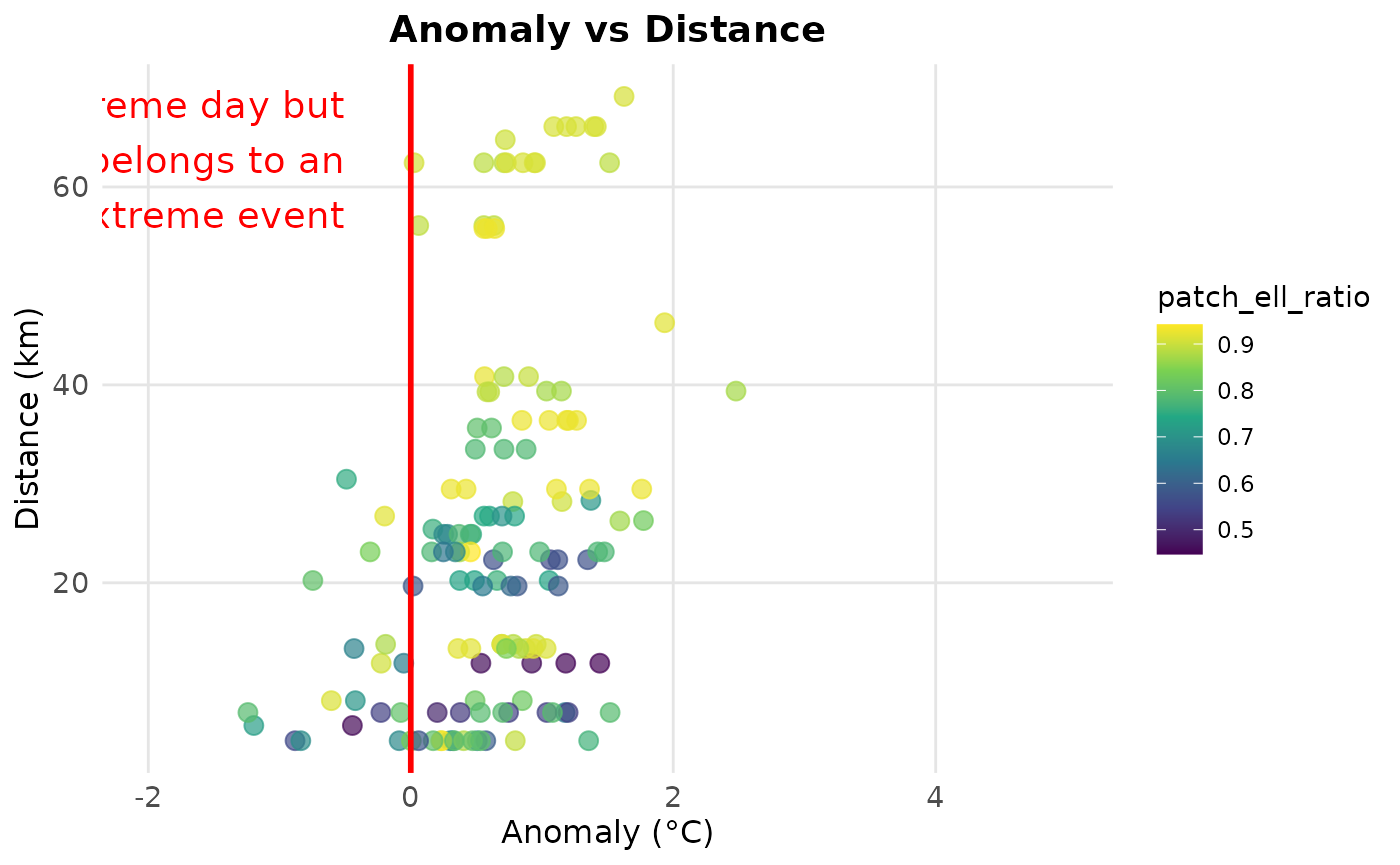
Since BEE.data.merge() only works with continuous daily data, the output also has continuous daily data. Therefore, many days in the output do not correspond to an extreme event. You can remove them as follows:
pixel_108 <- as.data.frame(merged_ouputs[["108"]])
pixel_108_EE <- pixel_108[pixel_108$cleaned_value == 1,]
#converte message to NA :
pixel_108_EE$anomaly_qt <- as.numeric(pixel_108_EE$anomaly_qt)
pixel_108_EE$distance <- as.numeric(ifelse(pixel_108_EE$distance=="outside of the raster",80000,pixel_108_EE$distance)) #when there where no issues inside the raster, the distance to escape is set to 80 km
pixel_108_EE$patch_ell_ratio <- as.numeric(pixel_108_EE$patch_ell_ratio)

library(ggplot2)

ggplot(pixel_108_EE, aes(x = anomaly_qt, y = as.numeric(distance)/1000, color = patch_ell_ratio)) +
  geom_point(size = 3, alpha = 0.7) +
  geom_vline(xintercept = 0, color = "red", linetype = "solid", linewidth = 1) +
  annotate(
    "text",
    x = -0.5,
    y = Inf,
    label = "Not an extreme day but\nbelongs to an\nextreme event",
    color = "red",
    hjust = 1,
    vjust = 1.2,
    size = 5,
    fontface = "plain"
  ) +
  labs(
    title = "Anomaly vs Distance",
    x = "Anomaly (°C)",
    y = "Distance (km)",
    color = "patch_ell_ratio"
  ) +
  xlim(-2, 5) +
  scale_color_viridis_c() +
  theme_minimal() +
  theme(
    plot.title = element_text(size = 14, face = "bold", hjust = 0.5),
    axis.title = element_text(size = 12),
    axis.text = element_text(size = 11),
    panel.grid.major = element_line(color = "gray90"),
    panel.grid.minor = element_blank(),
    legend.position = "right"
  )