3.1 Identify extreme event according specific constraints
Victoria Delannoy, Nicolas Loiseau, Sébastien Villéger
Source:vignettes/e_id_extreme_event.Rmd
e_id_extreme_event.RmdAims of the function BEE.id.extreme_events()
Identify the extreme event according to a set of constraints (e.g. minimum duration, merging close events). BEE.id.extreme_events() transforms the extreme days identified with BEE.id.extreme_day() into coherent extreme events by applying temporal criteria such as minimum duration, merging events close in time, and removing isolated days. The two functions are complementary: binarise detects when conditions are extreme, while true_event defines which sequences of extreme days constitute meaningful events.
Usage
Arguments:
extreme_day: is a spatraster with one layer per day.
Each layer covers the same area and time is continuous (no layers are
missing). If you are not using a fixed threshold, the baseline
spatraster computed using BEE.calc.baseline() must be computed using the
same dataset as yourspatraster for comparison without bias.
n: The minimum number of consecutive days above the
baseline/threshol required for a series of days more extrem than the
baseline to be considered as an extreme event (≥).
d: The maximum number of days for which two series of
values above the threshold/baseline, separated by some days below the
threshold/baseline, can be considered a single extreme event (the
maximum distance in days between the two events to be merged
<=).
nbis: The minimum number of days in a series of 1 to
allow merging with #’ serie of 1 longer than ‘n’ and distant
from ‘d’ days or fewer. #’ /! ‘nbis’ must be inferior
or equal to ‘n’. This avoid extending an extreme event for only
a few extreme day. For instance: 0000100111110010000 will be considere
as an extreme event of duration 11 days when only using n = 5 and d= 2.
However, if you set nbis=2, lonely extreme days will not be merged and
the duration of the above event will be 5 days. It allows to be more or
less precautionious on the temporal extent of the extreme event.
Output
Returns a list with 2 elements.
The first one is called “extreme_event_spatraster”.
This SpatRaster contains the identified extreme events. Based on the
criteria specified in the function arguments, extreme events are derived
from the binarised extreme days by applying pixel-wise temporal rules
such as minimum event duration, merging of events that are close in
time, and the removal of isolated extreme days. These events are used in
the next function of the pipeline.
The second element is called “extreme_event_list”. This
is a list with one data.table per pixel. Each data.table has a date for
each row (and as many dates as there are layers in yourspatraster).
The dataframes in the output list “extreme_event_list” contains the followings collumns :
| Column name | Description | Class | Unit |
|---|---|---|---|
| pixel_id | Pixel number in the spatraster | integer | |
| original_value | Day more extreme than baseline = 1 | double | |
| Day less extreme than baseline = 0 | |||
| cleaned_value | Day belong to an exteme event = 1 | double | |
| Day outside of an extreme event = 0 | |||
| event_id | Number of the extreme event in the | integer | |
| time serie | |||
| duration | Duration of the period (extreme | integer | days |
| event or in between 2 events) | |||
| date | Date associated to the observation | double/date | |
| ID | The event identifier * | character |
* built using the pixel number, the first day of the event and the last day of the event and the event_id for that pixel. ID and event_id are proper to each pixel.
If the position in the list corresponds to a pixel number for which the pixel value is consistently NA, the data frame is a null object.
Note
The BEE.calc.corrections() function allows to check how many modifications your choices of settings in BEE.calc.tru_event have induced compare to row binerized data. Please check 3.bis. Check the number of modifications induced by the BEE.id.extreme_events() settings.
Examples
Load data:
library(BioExtremeEvent)
#Binarized spatraster built using BEE.id.extreme_day()
file_name_1 <- system.file(file.path("extdata", "copernicus_binarized.tiff"),
                                   package = "BioExtremeEvent")
binarized_data <- terra::rast(file_name_1)
Apply filter:
events <- BEE.id.extreme_events(extreme_day = binarized_data, n = 5, d = 2)Spatraster output:
# Get the corrected spatraster:
extreme_event_spatraster <- events[[1]]

# Plot a layer
date <- terra::time(extreme_event_spatraster[[800]])
terra::plot(extreme_event_spatraster[[800]],
            main = as.character(date))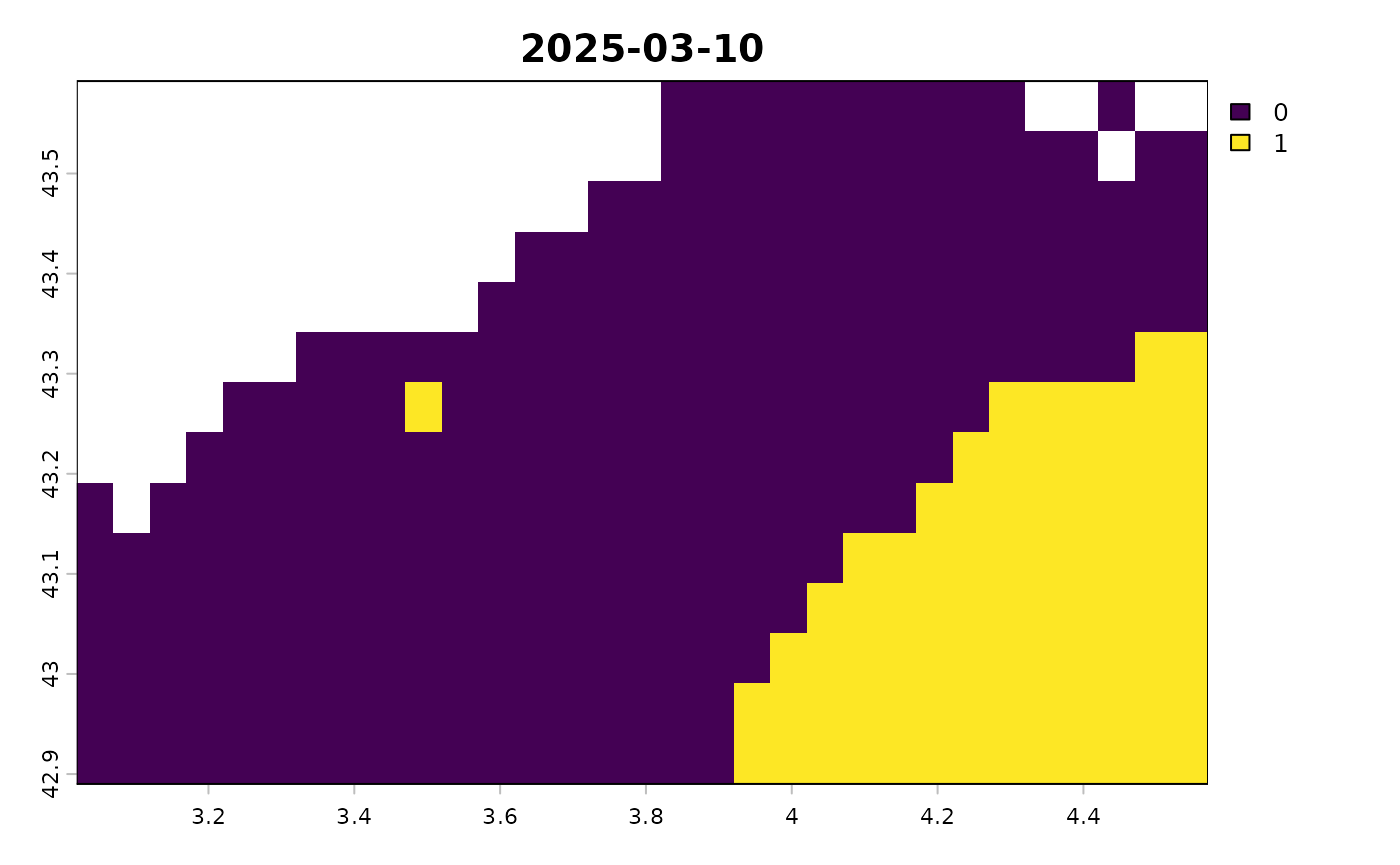
# Here 850 refers to the layers of the spatraster <-> 800th days of the spatraster.Get the list of data.table with former and corrected values and with dates and duration:
extreme_event_list <- events[[2]]
head(extreme_event_list[["80"]])
## NULL
# Here 80 refers to the pixel id. The 850th day correspond to the 850th row.How to save the ouputs:
Due to the different nature of the two outputs, they must be saved separately.
## Save the spatraster
extreme_event_spatraster <- events[[1]]
terra::writeRaster(extreme_event_spatraster, "your_path/data/binarized_corrected_spatraster.tiff")

## Save the list of df
extreme_event_list <- events[[2]]
saveRDS(extreme_event_list, file = "your_path/data/binarized_corrected_df.rds")
Please save both because they are both used in the next steps of the pipeline.